| |
|
|
| |
self-replicationThe presentation of self-replication - the most fundamental process in the nature - selfreplication that means exponential grow and spreading of structures. I would like to understand the process of spreading of structures, especially I focus on DNA selfreplication.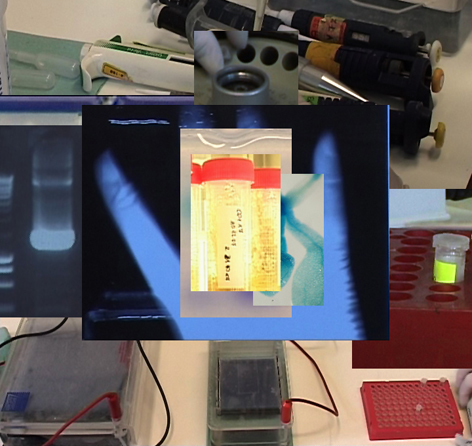 PCR real timeThe presentation of self-replication of DNA by using PCR real time [(Polymerase Chain Reaction in real time). I took the some genes from Eschericha Coli bacterium, precisely I gen of transferase glukozowa applying PCR real time. The speed of self-replication is fast and reaction accelerates exponentially. PCR real time is a process of selfreplication in wich I sart wit one DNA sequeance, after the first cycle I have two copies of DNA, and after 30 cycles you get over billion of DNA copies.presentationSelf-replication is presented as sound transmission of PCR output data and the synergic light projection . Next I wrote patches for pd and supercollider that translate PCR data into a space of sound and light. You can see the installation and lab exhibition of lab equipment and graphs/maps of the infection of Warsaw in the Leto Gallery.http://www.flickr.com/photos/33834437@N06/ 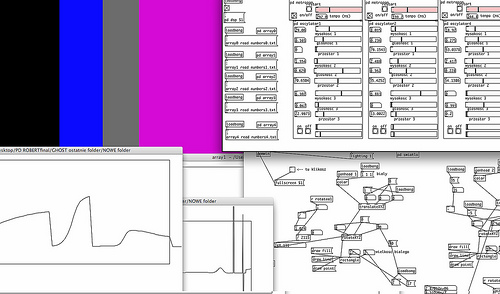
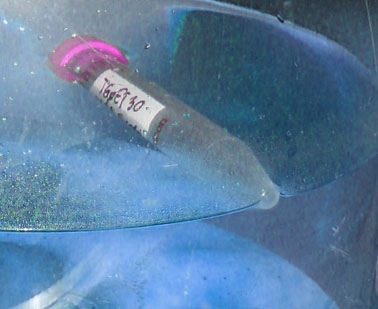
bacteriumI generated the new gender of the bacterium E-coli [1XkZF no name yet],that quickly spreads in the water. I injected a gene to Ecoli that is responsible for infection of homo sapience [overexpression of Shiga toxins (Stx). Ecoli has also been modified in order to accelerate the process of division of cell and spreading it in the water [overexpression FtsL gen] .
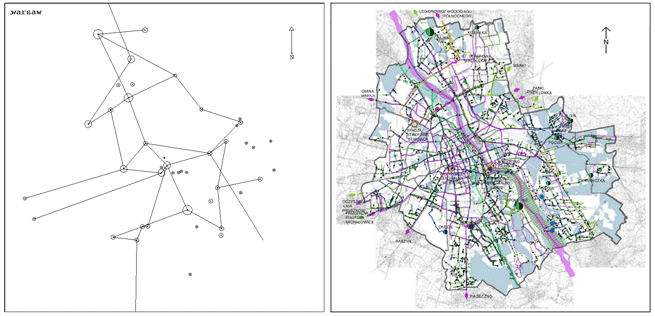
map/graphI also prepared a map/graph that represent the best way to infect Warsaw city. The map provides an understanding of how ?pathogens? (in this case the artist?s E-coli bacteria). spread and the connections between multiple biological and communicative networks. In graphic terms, a narrative of bacterial infection demonstrates how easily new dangerous bacteria strands can be grown and how quickly they might spread in a metropolis such as Warsaw[the graph is computed so that nodes show stations of water cleansing and weighted links represent power of water flow].http://robertlisek.com/gespenst_files/warsawAttackGRAPH.jpg
8. The exhibition at Leto
Gallery |
|
| |
produced by Robert B. Lisek & Fundamental Research Lab
|
|
