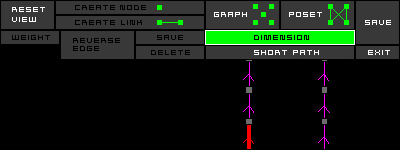
GRAPH (order of database)
current functionality :
1. nodes : displays the nodes in special colors ( no titles
), depend on weights of node/ number
of links, as some are different size / color.
2. titles : displays the titles of each node at the node in particular.
3. links : displays only the links, no nodes / titles at all.
4. Select : means that the user can click and drag a node at will.
5. Zoom : the user may drag a box, and that becomes the new display area
( normalized to the aspect ratio of course ).
6. Center : the user may click a node, and this node will be moved to the
center of the display area.
7. Rotate : the user clicks a non-node area, and by dragging may rotate
the whole graph according to his/her new mouse position.
8. Move : activates a pseudo-bouncy effect on the nodes when the user drags
a node.
9. Stop : removes the bouncy effect.
10. Add Node : when activated, the user creates a new node each time he/she
clicks the display area, and the new node is created at that point.
11. Add Link : the user may click a node, and by dragging the mouse will
create a new edge. If the user releases the mouse in a non-node area, then
the link is not created, else if the user releases the mouse over another
node, then a node is created.
12. View DAG : the view of the database as directed acyclic graph.
13. View Hasse : the view of the DAG as the Hasse diagram (graphical representation of partially ordered set).
14. View Dimentions : the view of linear extensions (topological sorts) of the partially ordered set.
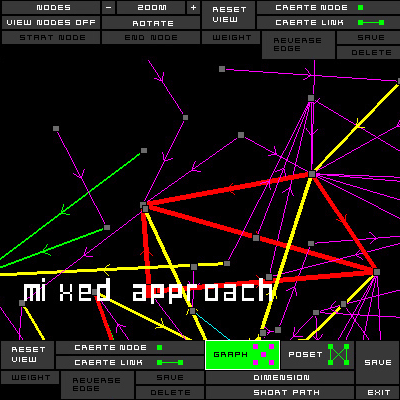
DOCUMENT (cell of data)
current functionality
double click on the node and edit document
1. title : displays the title of the node currently selected
2. creation date : displays the creation date of the node currently selected
3. author : displays the author of the node currently selected
4. content : displays a description of the node currently selected
5. save : save the document .
nodes
when toggled ( single click ), this turns to Titles. Effect : changes the display to show either the nodes plus titles, or just the nodes ( no titles ). If the next button, Show Nodes, is turned to off, then this button becomes inactive, grayed out. So the user cannot use this button when the Show Nodes is off, which makes sense, as the nodes are no longer being displayed. When the Show Nodes button is turned back on, the Nodes button re-activates, and shows the state it should be in correctly ( ie. It does not default back to Titles; it remembers ).
show nodes
As mentioned above, this has a particular effect on the Nodes/Titles toggle button. Its effect is to show / hide the nodes. When hidden, then the user only sees the edges of the graph.
zoom
allows the user to drag a box on the screen, and when the user releases the mouse, the box becomes the new viewport. However this is bounded by some sensible value, such as a node must be in the new viewport ,

rotate
When active, the user may drag any area of the viewport ( even on a node ), and that will cause the entire graph to rotate around the center point of the screen. The rotate button remains active until the user clicks it again, or presses Reset.

reset
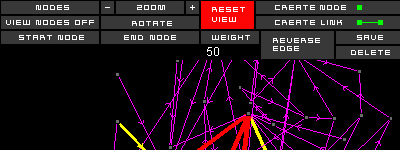
After a number of zooms / rotates / translations, it is possible for the user to lose track of his/her current position within the graph. The reset button causes all translations / zooms / rotations to cancel, and the viewport returns to its default view, which ideally displays the entire current graph. It also returns the Show Nodes toggle to on, and the Nodes/Titles to titles..
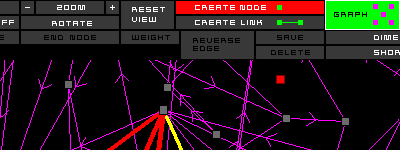
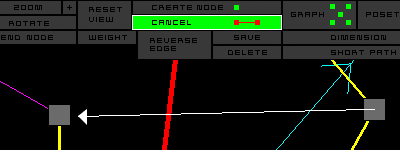
create node
Pressing this button causes the FLOAT application to wait for the user to specify the coordinates of a new node on the viewport. When the use clicks in the viewport, then these coordinates must not be within another node ( if there is contention for space, the user can always zoom in before creating the node, so there is more relative space ). Should the user wish to cancel his/her choice to create a node, then pressing the button again ( which has now toggled to a ‘cancel’ option ) will indeed cancel this action.
create edge
Almost identical to the above button, however in this case
the user is expected to select two nodes ( that must be different ) from
the viewport. These nodes are selected by single clicks or current draging
from one node to second.
view DAG (directed acyclic graph)
This is the default view when starting FLOAT, and also the only view where meaningful changes to the graph can be made. In this view, the user can move nodes, add links; all that has been discussed above regarding functionality is relevant to the Directed Acyclic Graph view.

view Hasse (Hasse diagram)
A secondary, optional, perspective of the graph. When this has been selected, then the graph is redrawn according to the DAG->Hasse diagram algorithm, and the following things happen regarding functionality : all forms of editing are disabled : move(node), edit edge / node / text, create node / edge. These are all restored upon return to the DAG view. All DAG can be transformed in the partially ordered set and represented using Hasse diagram !!! = all links are updraw directed (the documents in database are updraw ordered).
