POSETS CONTRA TREES!!!
Why all structures in our computer world are trees? Why we organize our databases and other sets of documents as trees? Why we reduce our thinking inference process to trees? Why we build so stupid WWW using only trees constructions?

GO TO POSETS (partially ordered sets)
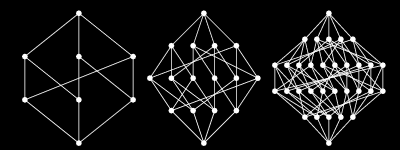
In order to organize information Float use DAG directed acyclic graph (directed graphs without directed cycle) in which their edges possess weight. Node (or cell) is any information unit: text, image, sound or other kind of data. Two nodes (units) are connected by directed edge. Each DAG can be treated as a POSET (partially ordered set = a set with binary relation which is reflexive, antisymmetric and transitive). Each poset can be draw as Hasse diagram (upward drawing DAG).Every DAG has at least one topological sort (linear extension), and we can use depth-first search to find such an ordering. A topological sort of a directed acyclic graph is an ordering on the vertices such that all edges go from left to right (see below). Topological sorts are called linear extensions in the theory of posets.


s:
different views
Therefore,information may be organized and visualized
in many different ways ( the user may see information in many different
ways):
1. as DAG
2. as Hasse diagram ( updraw DAG - see chapter > Hasse diagrams)
3. as a set of linear extensions by using topological sort of poset
(poset can be represented as the intersection of linear extensions
Fig. 01 The 4-element set viewed: as the digraph, as Hasse
diagram, as the intersection of two linear extensions (2 dimensions),
up-ordered linear extensions, right-ordered linear extensions

st:
weight!!!
What we call weights of links are numbers from range [0,50]. These numbers represent a degree of our believing that one document implicates another, in other words this is a degree of our believing that a document q has 'more information' than p or p is 'less defined' than q. By selecting two nodes and starting Dikstras algorithm the user may find the shortest path which has in the same time strongest connection between nodes. So the user can check a probability that information that is contained in one of them implicates information contained in another. As a result the user can see a drawing of this path and a number from the range [0,50].

shortcut:
A!!!
IMPORTANT IS THAT WE CAN THINK ABOUT DAG AS ABOUT POSET.

shortcut:
dimension of poset
Fig 02 (below) The 7-element set as the digraph, as Hasse diagram, as the intersection of 3 linear extensions (3 dimensions): view in dimension d1,d2,d3, up-ordered linear extensions, right-ordered linear extensions

Background
The data structure is as simple as you can get : a vector of Nodes, a vector of Edges. The owner of these vectors defines an interface for the rest of the application to access the graph, and there are some very nice algorithms here. In particular, there is a path searching algorithm, to detect potential cycles, as well as conversion from DAG->Hasse, and DAH->LinearExtensions. DAG->LE can be extended to any number of extensions, limited only by the graph, depending how the edges are searched.
Related files:
